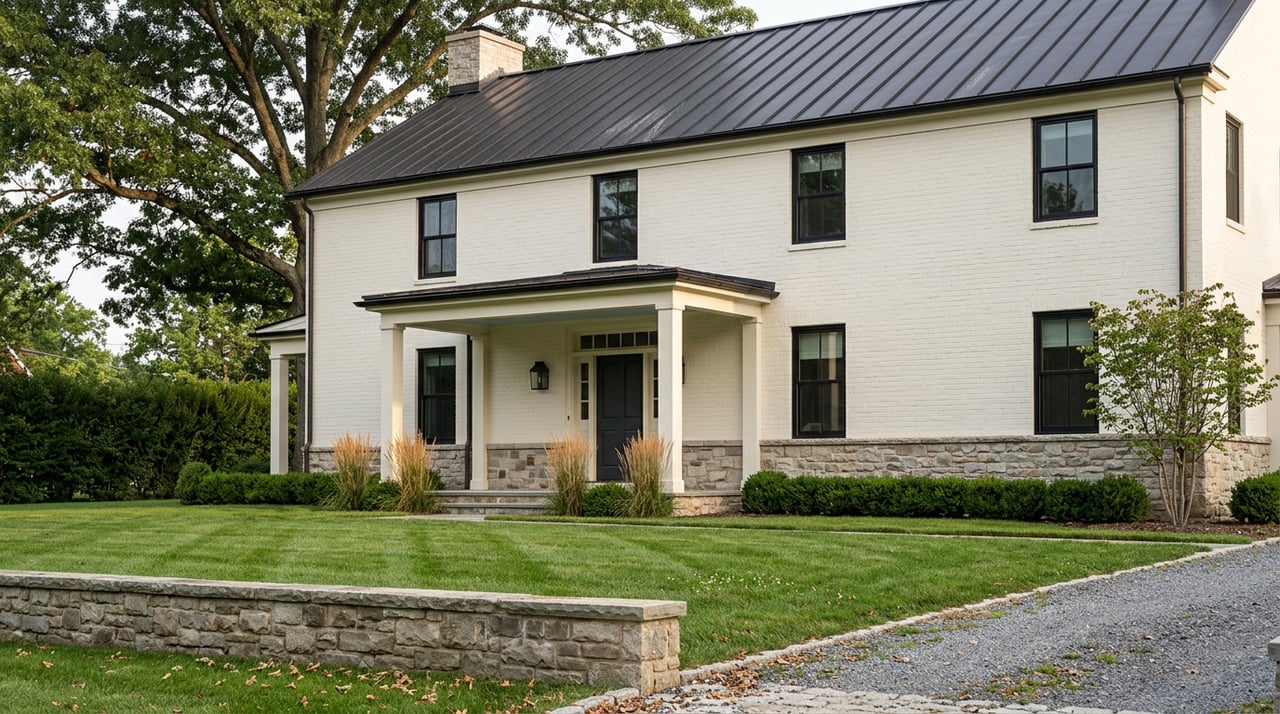
Versailles KY Home Prices: Why the Monthly Median Bounces Around More Than the Market Does
August 13, 2026
August 13, 2026
"While home prices have leveled off, the overall market remains remarkably resilient." That is how Mike Inman, president of Bluegrass REALTORS, described the 38-county Central Kentucky region in his read on the spring numbers. It is a calm, steady sentence. It is also not the sentence you would write if you spent the past three months watching Woodford County alone.
If you have been tracking home prices in Versailles this year, you have seen a market that looks nothing like calm. April closed with prices up 11 percent. May turned around and posted the sharpest drop of any county Bluegrass REALTORS tracks, down 12 percent. June reversed again, jumping 19 percent to a median of $414,900, the largest single-month gain in the region. Read those three numbers in a row and you would assume Versailles is either overheating or cooling off depending on which month you happened to check. Neither read is right. The real story is about what a small number of closings can do to a headline, and it changes how you should shop, price, and time a move in this market.
Here is what the county-level breakdowns actually showed, month by month, alongside Fayette County (Lexington) for comparison:
| Month (2026) | Woodford County price change | Fayette County price change |
|---|---|---|
| April | +11% (median $350,000) | +11% |
| May | -12% (26 closings) | +2% (408 closings) |
| June | +19% (median $414,900) | +4% (median $365,000) |
| Year-to-date through June | +6% (median $374,000; 143 sold) | +4% (median $350,000; 1,944 sold) |
Look at the spread in the Woodford column: 11, negative 12, 19. Now look at Fayette: 11, 2, 4. Both counties sit in the same region, get pulled by the same interest rate environment, and report through the same association. One county swings by double digits in either direction from month to month. The other barely moves off its own trend line. That gap is the whole point of this piece.
The explanation is not mysterious once you see the volume behind it. Woodford County closed only 26 homes in May and 34 in June. Fayette County closed 408 and 419 in the same two months. When a county's entire monthly sample is smaller than a single suburban subdivision's annual turnover, one or two unusual sales can move the reported median without any change in what typical buyers are actually paying.
Bluegrass REALTORS' own analysis of the May dip made this explicit: a shift in the mix of properties closing, a few fewer high-end transactions or a few more mid-range ones, can swing the county median without signaling any real change in the underlying market. The June rebound to $414,900 got the same explanation in reverse: the jump reflected the upper-end nature of what happened to close that month in Versailles and Midway, not a sudden surge in what the typical home is worth.
Versailles has more of these upper-end closings sitting in its pipeline than most Central Kentucky towns its size. This is horse country in a literal sense. Ashford Stud, part of the Coolmore international thoroughbred breeding operation, sits in Woodford County. Woodford Reserve's Labrot & Graham Distillery draws its own stream of relocation and second-home buyers. Downtown Versailles supports restaurants like Holly Hill Inn, Black Tulip, and Heirloom, the kind of dining scene that tends to travel with a higher-end buyer pool. When a farm property or an estate near one of these draws closes in a given month, it can pull the whole county median up or down by a margin that would be invisible in a county with hundreds of closings to absorb it.
There is a second layer of confusion here, and it comes from comparing sources that are not measuring the same thing. As of June 30, 2026, the average Versailles home value sat at $360,177, down 2.1 percent over the past year, with homes going to pending in around 9 days. That is a smoothed, rolling average built to track gradual change over a full year. The monthly county median swinging between $350,000 and $414,900 is a different measurement entirely: a raw snapshot of whatever actually closed in a 30-day window, calculated from a sample of two or three dozen sales.
Neither number is wrong. They are answering different questions. The rolling average tells you where typical value has drifted over twelve months. The single-month median tells you what happened to close in the last 30 days, which in a market this thin can be dominated by whichever handful of properties happened to finish their closings that month. If you only see the monthly figure quoted in a headline, you are seeing the noisiest version of the story available.
The number worth anchoring to is the year-to-date figure, because it smooths out the mix-shift effect that distorts any single month. Through June 2026, Woodford County has closed 143 homes at a median of $374,000, up 6 percent from the same point last year. That is a real, defensible trend: modest appreciation, rising volume, and a market that is absorbing more transactions than it did in 2025 (109 sold by May, up from 90 the year before, a 21 percent increase in activity even as the price read jumped around).
Compare that to Fayette County's year-to-date read of 1,944 homes sold, up 10 percent from 1,768, at a median of $350,000, up 4 percent. Fayette's larger sample means its month-to-month numbers already look like its year-to-date trend. Woodford's smaller sample means you have to wait for the year-to-date figure to see the trend at all.
Is Versailles currently a buyer's market or a seller's market? Neither label fits cleanly. Demand has stayed steady enough that year-to-date volume is up 17 percent over last year, and homes are still going to pending quickly, around 9 days as of late June 2026. But the price swings mean neither buyers nor sellers should expect a single month's headline to dictate their strategy.
Why does my Zillow estimate look different from the number in local market reports? They are measuring different things. A rolling home value average is built to track gradual change over a full year and smooths out short-term noise. A monthly median from local MLS data reflects whatever actually closed in that specific 30-day window, which in a market as thin as Woodford County can be skewed heavily by one or two unusual sales.
How many homes actually sell in Woodford County in a typical month? Recent months have ranged from 26 to 34 closings countywide, compared to roughly 400 in Fayette County over the same stretch. That difference in sample size is the entire reason Versailles headlines move so much more than Lexington's do.
If you are trying to figure out what a specific Versailles or Woodford County property is actually worth, or you want a read on how a particular street or subdivision has traded over the past year rather than the past month, that is a conversation worth having before you set a list price or make an offer. Kim Hurst has been working Central Kentucky's markets long enough to know which monthly swings mean something and which ones are just noise. Let's Connect.
Stay up to date on the latest real estate trends.
Whether you’re buying, selling, or simply exploring your options, I am here to help. Let’s embark on this journey together, turning your real estate dreams into reality. Contact me today to schedule a consultation and take the first step towards finding your perfect place to call home.